THE BIG PICTURE: WHY INVESTORS SHOULD CARE
Indians do not just wear gold; they worship it, marry with it, and use it to store generational wealth. But beneath the surface of this deep cultural affinity lies a ruthless, hyper-competitive, and incredibly lucrative corporate battleground.
For decades, the Indian jewellery market was dominated by local, unorganized family jewelers. Today, a massive structural wealth transfer is underway. Armed with rising incomes and demanding absolute purity, consumers are shifting toward trusted, organized corporate brands.
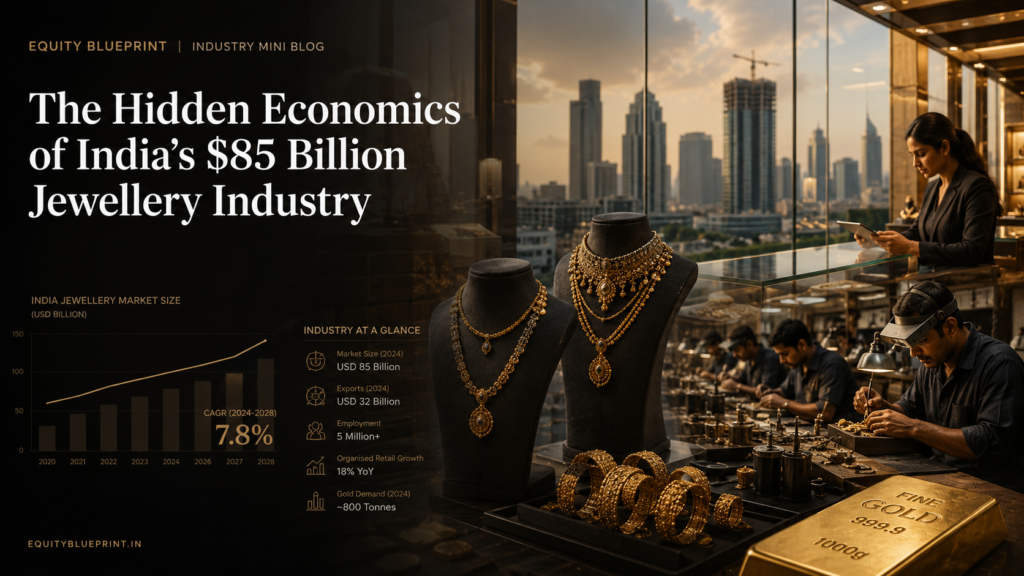
This is not just an industry overview; this is a deep-dive Indian jewellery industry analysis. We will unpack the hidden economics, competitive moats, profit pools, and financial DNA of a sector projected to grow from US$ 85 billion today to US$ 130 billion by 2030. The macro relevance is undeniable: the Gems & Jewellery sector currently contributes 7% to India’s GDP and employs over 5 million skilled and semi-skilled workers.
INDUSTRY AT A GLANCE
| Metric | Industry Data |
| Current Industry Size | Rs. 7,31,255 crore (US$ 85 billion) |
| Projected Size (2030) | Rs. 11,18,390 crore (US$ 130 billion) |
| Major Segments | Cut & Polished Diamonds (55% of exports), Gold Jewellery (39% of exports), Silver, Lab-Grown Diamonds |
| Key Players | Titan (Tanishq), Kalyan Jewellers, Malabar Gold & Diamonds |
| Industry Type | Structural Growth with Defensive characteristics |
| Key Growth Drivers | Demographics (Weddings), Formalization (shift to corporate brands), Rising Incomes |
THE EVOLUTION OF INDIAN JEWELLERY (2010 → 2030)
To understand where the jewellery sector outlook in India is headed, you must understand where it came from. Professional investors map historical context to predict future consolidation.
| Era | Market Reality | Investor Takeaway |
| 2010 | Mostly unorganized. Local jewelers dominate. | Trust is based purely on personal family relationships. |
| 2015 | Hallmark awareness rises. Purity becomes a question. | Corporate brands introduce transparency (e.g., Karatmometers). |
| 2020 | Pandemic accelerates the shift to organized brands. | Smaller jewelers struggle with working capital; big brands swallow market share. |
| 2026 (Current) | Organized jewellery market share in India hits ~40%. | Omni-channel dominance. Aggressive national expansion by top players. |
| 2030 (Future) | Projected 60-70% organized share. Lab-Grown Diamonds scale. | Massive consolidation. Only brands with strong digital presence and localized supply chains thrive. |
INDUSTRY STRUCTURE (PORTER’S FIVE FORCES)
To assess jewellery industry risks, we must look at its structural power dynamics. The industry is highly segmented, with Cut & Polished Diamonds accounting for roughly 55% of exports and Gold Jewelry making up 39%.
- Supplier Power (HIGH): India imports almost all of its raw gold. Suppliers dictate the baseline price, leaving companies at the mercy of global commodity cycles.
- Customer Power (MEDIUM): Customers can easily walk into three different stores to compare “making charges” (design fees). However, brand trust reduces this power. Customers will pay a premium if they deeply trust the brand’s purity.
- Threat of New Entrants (LOW to scale, HIGH locally): Anyone can open a single jewellery shop. But building a national, trusted brand requires decades of capital and reputation building. The barrier to entry for scale is incredibly high.
- Threat of Substitutes (LOW but shifting): Culturally, there is no substitute for gold at an Indian wedding. However, for everyday fashion, Lab-Grown Diamonds (LGDs) are becoming a powerful substitute for natural diamonds.
- Competitive Rivalry (HIGH): The battle between national giants (Titan, Kalyan) and aggressive regional players (Joyalukkas, Senco) is fierce, fought over real estate and ad spend.
INDUSTRY ECONOMICS — WHERE IS THE MONEY MADE?
Investors often confuse a big industry with a profitable one. “How the chain works” matters less than “Where the money is captured.”
The Industry Value Chain & Profit Pool Map:
| Value Chain Stage | Key Activities | Typical Margin | Industry Dynamics |
| Raw Material Sourcing | Mining & Importing | VERY LOW (1-2%) | Pure commodity volume game. |
| Manufacturing & Refining | Cutting, Polishing, Design | LOW-MEDIUM (4-8%) | Artisans and factories earn making charges. |
| Wholesale Distribution | Logistics & B2B Sales | LOW (2-4%) | Moving bulk inventory with high capital lock-up. |
| Branded Retail | Customer Experience | HIGH (10-15%+) | Captures the ultimate design & trust premium. |
Takeaway: Never value a gold refiner and a branded jewelry retailer using the same multiple. The retailer owns the customer and captures the lion’s share of the profit; the refiner just moves the metal.
WHO ARE THE MAJOR PLAYERS?
The organized market is fiercely competitive but highly rewarding for the winners.
| Company / Brand | Business Model | Market Position | Key Strengths |
| Titan Company (Tanishq) | House of Brands (Tanishq, Zoya, Mia, CaratLane) spanning luxury to everyday wear. | Industry Leader (~8.5% total market share, dominant in organized space) | Impeccable Tata brand trust, exceptional Return on Capital Employed (ROCE) of 32%, deep omni-channel presence. |
| Kalyan Jewellers | Hyper-local strategy. They tailor their showroom designs to match the specific cultural tastes of different Indian states. | Leading National Player | Deep penetration in non-metro markets, strong localized supply chain. |
| Malabar Gold | Massive showroom footprint with a focus on transparent pricing and lower making charges. | Leading Global & National Player | Aggressive international expansion, particularly dominating the Middle East (GCC) market. |
THE FINANCIAL DNA OF A JEWELLERY BUSINESS
A jewelry company is entirely different from IT or Banking. If you do not understand the math below, you cannot conduct a proper jewellery sector investment analysis.
1. Revenue Drivers (How they grow the top line)
Revenue = Footfalls × Conversion Rate × Average Ticket Size
- Footfalls: How many people walk into the store (driven by marketing and store network).
- Conversion: How many actually buy (driven by design assortment and staff).
- Ticket Size: How much they spend (driven by gold prices and premiumization).
2. Profit Drivers (How they grow the bottom line)
Profit = Making Charges + Studded Mix + Inventory Turnover
- Making Charges: The fee charged for the design.
- Studded Mix: Diamonds and gemstones yield drastically higher margins than plain gold.
- Inventory Turnover: How fast they sell the gold sitting in the vault.
3. Working Capital: The Silent Killer
Jewellery businesses can look profitable on paper while bleeding cash.
- Inventory Days (High): Stores must hold massive, expensive displays of gold.
- Receivable Days (Low): Customers pay immediately (cash/card).
- Payable Days (Moderate): Time taken to pay suppliers.
- The Secret: Cash Conversion Cycle. The best companies run franchisee models (where the franchisee buys the inventory) or use gold metal loans to keep their own cash free.
INDUSTRY KPI DATABASE
When reading a quarterly report, ignore the noise and benchmark the company against this proprietary Equity Blueprint KPI Table:
| Key Performance Indicator (KPI) | What it Means | Good Range | Danger Zone |
| ROCE (Return on Capital) | How efficiently cash is turned to profit. | > 20% | < 12% |
| Studded Ratio | % of sales from diamonds/gemstones. | > 30% | < 15% |
| SSG (Same Store Growth) | Sales growth from existing stores only. | > 8% | Negative |
| Inventory Turnover | How many times inventory is sold per year. | Rising | Falling |
| Debt-to-Equity | Reliance on loans to fund inventory. | < 0.5x | > 1.0x |
COMPETITIVE ADVANTAGE (WHY WINNERS WIN)
Investors buy moats, not just industries. Let’s look at two different models:
1. Titan Company (Tanishq) – The Ecosystem Moat
Why Titan wins: Titan didn’t just sell gold; they sold trust using the Tata name and the Karatmometer (showing exact purity). Their moat is their ecosystem: massive scale, efficient procurement, high studded ratio (~34%), and an asset-light franchisee network yielding a stunning 32% ROCE.
2. Kalyan Jewellers – The Hyper-Local Moat
Why they survive and thrive: India is not one country; it is 28 different consumer markets. Kalyan’s moat is “hyper-local” design. The wedding jewellery worn in Kerala is entirely different from Punjab. Kalyan designs specifically for regional tastes, allowing them to steal share from local jewelers effectively.
INDUSTRY CYCLES & BEHAVIOR
The gold jewellery market in India is subject to distinct cycles:
- Gold Bull Markets (Prices Rising): Companies record “inventory gains” (the gold in their vault is suddenly worth more). However, sudden price spikes cause “sticker shock,” and customer footfalls drop temporarily.
- Gold Bear Markets (Prices Falling): Companies can face inventory losses. However, lower prices usually trigger massive volume buying from consumers.
- Wedding Cycles: The industry is highly seasonal. Q3 (October-December) is historically the strongest due to Diwali and the onset of the Indian wedding season.
THE 2030 OUTLOOK (DISRUPTION & EVOLUTION)
Where is the industry going over the next 5 to 10 years?
- The Lab-Grown Diamond (LGD) Disruption: LGDs are chemically identical to mined diamonds but cost significantly less. This will disrupt the industry. Winners will be companies (like Titan with ‘beYon’) that create separate LGD brands to capture young, everyday-wear buyers without cheapening their luxury natural diamond brands.
- Digital Retail & Virtual Catalogs: The future is Omni-channel. Consumers will use Augmented Reality (AR) to “try on” jewellery at home, shortlist 3 items, and visit the store only to make the final payment.
- Younger Consumers: Gen Z and Millennials have lower “gold intensity” (they care less about gold weight as an investment) and higher “design intensity” (they want beautiful, lightweight fashion pieces). Margins will shift toward design and away from pure weight.
EQUITY BLUEPRINT EVALUATION FRAMEWORK
Elite financial platforms do not just list metrics; they organize them into a repeatable, multi-layered evaluation framework. Before investing in any jewellery stock, run it through these five distinct analytical layers:
Layer 1: Growth Runway & Formalization
- Check: Same Store Sales Growth (SSG).
- Why: Investors need to verify if a brand’s growth is driven by genuine consumer pull and the structural shift to organized retail, or if it is just artificially inflating revenue through aggressive, unprofitable storefront expansion.
Layer 2: Margin Architecture & Product Mix
- Check: The Studded Ratio.
- Why: This evaluates the company’s ability to shift away from low-margin commodity gold toward high-margin diamond and gemstone categories. A rising studded ratio is the clearest signal of premiumization.
Layer 3: Capital Efficiency & Debt
- Check: Return on Capital Employed (ROCE) and Debt-to-Equity.
- Why: This proves whether management can scale physical showrooms using internal cash flows rather than drowning the balance sheet in high-interest debt to fund expensive display inventory. A “capital light” franchisee model is ideal.
Layer 4: Risk Mitigation & Commodity Hedging
- Check: Gold Procurement & Hedging Strategy.
- Why: A world-class operator must protect its earnings through efficient financial insurance (hedging) rather than speculating on global gold price volatility. Companies that leave their inventory unhedged are gambling, not retailing.
Layer 5: Valuation & Decision Discipline
- Check: The Trust Premium vs. Market Price (P/E Multiple).
- Why: A great company is not always a great stock. Determine whether the brand’s competitive moat (trust, scale, design ecosystem) justifies its current trading multiple. Overpaying for a brand, even a dominant one, can destroy investor returns.
KEY TAKEAWAYS & VERDICT
The Indian organized jewellery sector represents one of the most reliable, structural compounding stories in the market.
- Biggest Opportunity: The relentless march of formalization (moving from 40% to 70% organized share).
- Biggest Risk: Mismanagement of working capital and sudden regulatory shocks to gold import duties.
- Most Important Metric: ROCE (Return on Capital Employed). In a high-inventory business, capital efficiency separates the compounders from the wealth destroyers.
Equity Blueprint Industry Scorecard:
- Industry Attractiveness Score: 9.5/10
- Growth Potential Score: 9.0/10
- Risk Score: 4.5/10
Educational Disclaimer
This article is intended solely for educational and informational purposes. It explains the structure, economics, profit pools, and risks of the industry discussed. It should not be interpreted as investment advice, stock recommendations, or a prediction of future returns. Investors should conduct their own research and assess their risk tolerance before making investment decisions.
About the Author

Nilendu Chatterjee is the founder of Equity Blueprint, a platform focused on helping retail investors approach the stock market with clarity, structure, and discipline. With over a decade of experience in the industrial sector and a strong passion for equity research, he brings a practical, ground-level perspective to fundamental analysis.
Through a framework-driven approach, Nilendu breaks down complex businesses into simple, decision-oriented insights—bridging the gap between professional-grade research and everyday investing. His work is centered on one goal: enabling long-term wealth creation by replacing speculation with structured thinking.