
TL;DR (Executive Summary)
Waaree Renewable Technologies has delivered one of the fastest growth trajectories in India’s renewable EPC space.
But beneath the exponential numbers lies a more nuanced reality.
This is not yet a clean compounding business—it is a policy-backed, execution-driven growth story entering a capital-intensive transition phase.
Verdict: HOLD (Accumulate on corrections, not blind buying)
Introduction: India’s Solar Boom Is Real—But Not All Growth Is Equal
India’s renewable energy transition has moved beyond policy intent into execution scale. With a 500 GW target by 2030, solar EPC companies are witnessing unprecedented demand visibility.
At the center of this shift is Waaree Renewable Technologies Ltd—a company that has transformed from a ₹6 crore entity into a ₹3,300+ crore revenue business in just six years.
On the surface, this looks like a textbook multibagger.
But here’s the critical question:
Is this sustainable long-term wealth creation—or a high-growth cycle being mistaken for structural compounding?
This Waaree Renewable fundamental analysis answers that using a disciplined 5-layer framework.
Waaree Renewable Technologies: FY26 Financial Snapshot
| Metric | Value |
| Current Price | ₹1,028 |
| Market Cap | ₹10,728 Cr |
| PE Ratio | 22.4 (vs Industry ~27.7) |
| PEG Ratio | 0.21 |
| Debt-to-Equity | 0.16 |
| ROE / ROCE | 68.9% / 83.6% |
| Revenue Growth (FY20 → FY26) | ₹6 Cr → ₹3,331 Cr |
| Profit Growth (FY20 → FY26) | ₹1 Cr → ₹641 Cr |
| Current Ratio | 1.35 |
| Free Cash Flow (3 yrs) | ₹718 Cr |
📊 Core Thesis
Waaree Renewable is a high-growth EPC execution story riding a powerful policy tailwind—but its future depends on margin sustainability and capital allocation discipline, not just revenue growth.
Visual Insight: The Scale of Growth
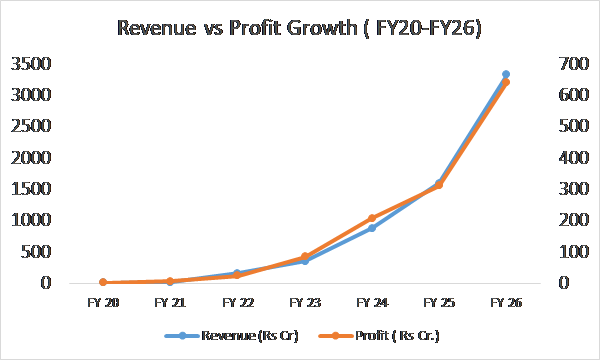
Revenue has scaled exponentially from ₹6 Cr to ₹3,331 Cr, while profit growth to ₹641 Cr indicates improving operating leverage and execution strength.
Layer 1 – Valuation Discipline: Cheap vs Justified
At a PE of 22.4, Waaree Renewable appears cheaper than the industry average. The PEG ratio of 0.21 further strengthens the case for undervaluation.
But valuation without context is incomplete.
To understand whether this is truly cheap, we need to benchmark against peers:
Peer Comparison: Renewable EPC & Solar Ecosystem
| Company | PE | PEG | Debt/Equity | ROE | ROCE |
| Waaree Renewable | 22.4 | 0.21 | 0.16 | 68.9% | 83.6% |
| Waaree Energies | 27.3 | 0.14 | 0.26 | 27.4% | 34.9% |
| Apar Industries | 46.7 | 0.97 | 0.14 | 19.5% | 32.7% |
| Premier Energies | 34.4 | 0.12 | 0.47 | 53.6% | 41.1% |
| Emmvee Photovoltaic | 33.3 | 0.14 | 2.15 | 105% | 28% |
Interpretation
Waaree Renewable stands out for:
- Exceptionally high ROCE (83%+)
- Low leverage
- Moderate valuation vs peers
However, this raises a critical question:
Why is an EPC company delivering such unusually high returns?
Either:
- It has structural advantages
- Or current margins are temporarily elevated
Given the lack of margin breakdown, the second possibility cannot be ignored.
Capital Allocation Inflection (Critical Insight)
The company is now moving from asset-light EPC → asset-heavy IPP + BESS
This matters because:
- EPC = high turnover, low capital intensity
- IPP = high capital, long payback
- Result = ROCE compression risk
Conclusion:
Valuation is reasonable—but not “cheap” once sustainability risks are considered.
Layer 2 – Growth Consistency: Hypergrowth vs Durability
The numbers are extraordinary:
- Revenue: ₹6 Cr → ₹3,331 Cr
- Profit: ₹1 Cr → ₹641 Cr
But growth quality matters more than growth speed.
The company’s evolution shows clear phases:
- FY20–21: Survival phase
- FY22: Group-driven scale
- FY23–25: Execution-led hypergrowth
- FY26: Strategic expansion
Quarterly trends reinforce this:
- Strong QoQ revenue and profit surge
- EBITDA margins expanding to ~20%
- Operating leverage kicking in
However, EPC businesses are inherently:
- Project-based
- Revenue-lumpy
- Execution-dependent
Key Insight:
This is execution-driven growth, not recurring compounding.
Layer 3 – Management Execution: Strong Delivery, Emerging Narrative Risk
Management has demonstrated strong execution capability:
- Rapid scale-up
- Large project wins
- Margin expansion
But the communication pattern reveals a subtle shift.
“The company’s narrative has evolved from data-driven execution reporting to forward-looking positioning language—‘well positioned’, ‘strong pipeline’, ‘opportunity’—with reduced clarity on financial drivers.”
This is not a red flag—but it is an early signal.
Additional concerns include:
- Margins consistently above guidance—but unexplained
- Order book decline not clearly addressed
- Increasing reliance on “pipeline” narrative
Editorial Insight
Execution credibility = Strong
Transparency on financial drivers = Moderating
Layer 4 – Risk Identification: Cyclical vs Structural
Cyclical Risks (Expected)
- Revenue lumpiness (project timing)
- Margin volatility (project mix)
- Cost sensitivity (modules, execution delays)
These are normal for EPC businesses.
Structural Risks (Critical)
1. Policy Dependency (High)
Growth is heavily driven by:
- ALMM
- PLI scheme
- Renewable targets
Policy drives demand—not just supports it.
2. Margin Sustainability Risk
- High margins (~20%)
- No clear cost breakdown
- Potential normalization risk
3. Capital Intensity Risk
Shift into:
- IPP
- BESS
- Hydrogen
👉 This introduces:
- Higher debt
- Lower ROCE
- Longer payback cycles
4. Order Book Quality Opacity
- No clarity on EPC vs turnkey vs module mix
- Revenue predictability remains uncertain
5. Narrative vs Reality Gap
- Presentation heavily forward-looking
- Limited quantified guidance
- Group vs entity scale confusion
Layer 5 – Decision Discipline & Final Verdict
Waaree Renewable Technologies is a high-quality execution story—but not yet a proven long-term compounder.
It benefits from:
- Strong policy tailwinds
- Integrated ecosystem advantage
- Execution capability
But key uncertainties remain:
- Margin sustainability
- Capital allocation discipline
- Cash flow transparency
⚖️ Final Verdict: HOLD (Accumulate on Corrections)
This is not a stock to chase aggressively.
It is best suited for:
✔ Growth investors who actively track developments
✔ Investors comfortable with cyclical + structural mix
Not suitable for:
❌ Passive “buy and forget” investors
❌ Pure quality compounder portfolios
Key Factors to Monitor (Next 2–3 Quarters)
- Q2 / Q3 earnings calls: Margin breakdown clarity
- Order book disclosure: Mix and conversion visibility
- Cash flow data: Working capital trends
- Capex announcements: IPP and BESS investments
- Debt trajectory: Early signs of leverage increase
Final Investor Insight (Most Important)
This is a cycle beneficiary being priced like a structural compounder.
That gap—between perception and reality—is where both opportunity and risk lie.
FAQs
Is Waaree Renewable Technologies overvalued?
Not on headline PE or PEG metrics. However, valuation depends heavily on margin sustainability and capital allocation outcomes.
What are the risks of investing in solar EPC companies?
Key risks include:
- Project-based revenue volatility
- Working capital intensity
- Margin pressure from competition
- Policy dependency
Is Waaree Renewable a long-term wealth creator?
Potentially—but only if it successfully transitions into a capital-efficient, sustainable business model beyond EPC execution.
Why are margins so high currently?
Margins appear elevated due to favorable project mix and operating leverage, but lack of disclosure makes sustainability uncertain.
Data Sources & Attribution
Market Data: Real-time price action and corporate announcements provided via the National Stock Exchange of India https://www.nseindia.com/
Financial Metrics: Historical fundamental data, ratios, and peer comparisons sourced from Screener.in https://www.screener.in/
Company Disclosures: Statutory filings, annual reports, and investor presentations sourced directly from the Company’s Investor Relations desk. https://waareertl.com/
Related Analysis
NTPC Ltd (NSE: NTPC) – Undervalued Utility or Execution-Risk Energy Giant? A Complete Fundamental Analysis (2026) NTPC Ltd (NSE: NTPC) – Undervalued Utility or Execution-Risk Energy Giant? A Complete Fundamental Analysis (2026)
Tata Power Share Analysis 2026 | 5-Layer Framework | Growth Story or Execution Trap? Tata Power Share Analysis 2026 | 5-Layer Framework | Growth Story or Execution Trap?
Disclaimer
The analysis provided on this blog, including the “5-Layer Framework,” is for educational and informational purposes only. I am not a SEBI-registered investment advisor. Stock market investing involves significant risk, and past performance is not indicative of future results. The views expressed here are my personal opinions based on my research and study of financial literature. This is not a buy or sell recommendation. Please conduct your own due diligence or consult a qualified, SEBI-registered financial advisor before making any investment decisions. The author may or may not hold positions in the stocks discussed.
About the Author

Nilendu Chatterjee is the founder of Equity Blueprint, a platform focused on helping retail investors approach the stock market with clarity, structure, and discipline. With over a decade of experience in the industrial sector and a strong passion for equity research, he brings a practical, ground-level perspective to fundamental analysis.
Through a framework-driven approach, Nilendu breaks down complex businesses into simple, decision-oriented insights—bridging the gap between professional-grade research and everyday investing. His work is centered on one goal: enabling long-term wealth creation by replacing speculation with structured thinking.